Using LLMs to Work with Data
Can LLMs help with your data analysis?
Introduction
One of the critiques of LLMs is that they don’t have great mathematical or reasoning capabilities.
While it’s true there are limitations on working directly with data, LLMs can be a powerful tool for data analysis working INDIRECTLY with data.
We built this demo to showcase how you can use LLMs to generate code and charts on top of a dataset: https://genaidataanalysis.com/
In this blog - we’ll share some of the techniques, tips and tricks used in the demo.
Why not use the LLM directly
Before we go into some of the techniques used for indirect analysis, I wanted to comment on the “why not just ask the LLM”. There are a couple very strong reasons why not to ask LLMs to do data analysis directly:
Context Window: While context windows are expanding, even the largest at 100k tokens is very small for many datasets.
Cost: Calculating many statistics on a relatively small dataset like the sample we use is virtually free in most programming languages/environments but you could rack up a decent bill fitting in long data context in many prompts using an LLM.
Calculation Efficiency: Calculations by the LLM are many orders of magnitude slower than with optimized math engines existing engines.
Accuracy: LLMs don’t use a mathematical engine instead they infer a response one word/number at a time. This may work for basic math calculations where examples exist in the training set but for unique calculations on a broad set you end up with an approximation (and sometimes no a good one)
As an quick example, I took the first 50 rows of the dataset and asked ChatGPT to create a total by product line:
Product Code: S10_1678 Total Sales: 76,727.13
Product Code: S10_1949 Total Sales: 97,148.99
A reality check using a pivot table in sheets, shows the LLM calculations are just not accurate:
S10_1678	97107
S10_1949	159745.52
Simply put, using an LLM directly (this excludes LLMs calling tools) is a bad idea for data analysis. But just because the LLM can’t crunch numbers, doesn’t mean it can’t behave as an analyst.
Suggesting Analysis
One useful tool for getting started on analysis is to have the LLM take a look a a snippet of the data and suggest useful types of analysis
Suggest 3 useful charts for analyzing the data below and return a response in the example format:
data: {datasample}

example:{example}
In our demo the results populate a multi-select box (with a choose you own added):
The suggestions could be even more useful if the prompt provided more context on the consumer or goals.
Generating Data Transformations
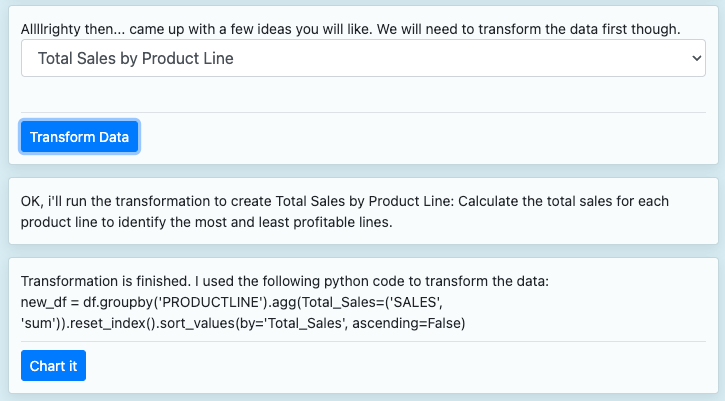
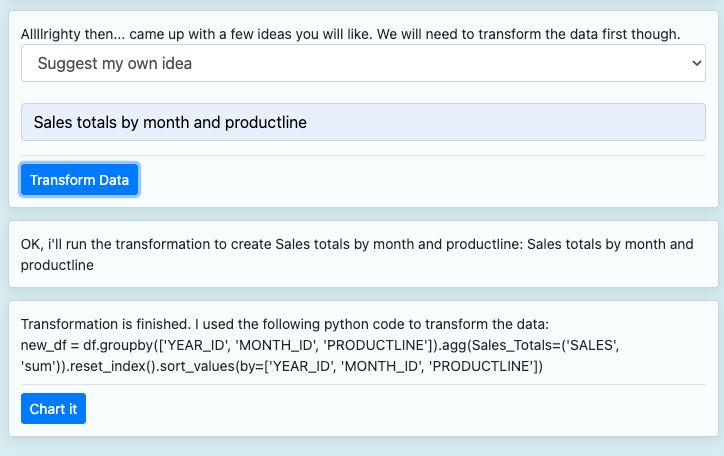
One of the most useful analytic tools in using an LLM is having the LLM generate code for a plain english data manipulation. For our demo we limited (via prompt) to use Python’s Pandas package, but this could be done using any package or language including Spark or other framework for distributed processing.
You can test out your own transformations by selecting “Suggest my own”
Writing Chart Code
As part of the demo, we wanted to test out whether the LLMs could generate code for charting the results of the transformation.
The Answer: Yes, but…maybe it’s not the best way.
The demo was initial setup to generate Javascript code from scratch given the aggregated data. This would allow for the maximum flexibility in type of chart and data structure as an input. However, there were a couple of drawbacks:
Latency: It takes quite some time to generated full javascript for a chart, and most of the code is repeated from chart to chart
Stability: Code acceptance rates by humans in tools like Github Co-Pilot are only at 30-40% right now. Part of this is that they don’t always run without error.
For the demo on the site, we switched to a different method of having AI fill in the variables:
In order to do this we pass a code template as part of the prompt like this pie chart code:
        function createChart() {
          const colors = ['#4CAF50', '#F44336', '#2196F3', '#FFEB3B', '#9C27B0', '#00BCD4', '#FF9800', '#795548', '#8BC34A', '#673AB7', '#E91E63', '#CDDC39', '#FF5722', '#3F51B5', '#009688', '#FFC107'];

          // Sort data in descending order
          const sortedData = transformedData.sort((a, b) => b.sortCol - a.sortCol);
          const chartData = sortedData.map(obj => obj.dataField);
          const chartLabels = sortedData.map(obj => obj.labelField);

            var ctx = document.getElementById('chart1').getContext('2d');
              var myChart = new Chart(ctx, {
                type: 'pie',
                data: {
                  labels: chartLabels,
                  datasets: [{
                    data: chartData,
                    backgroundColor: colors.slice(0, sortedData.length),
                    borderWidth: 1
                  }]
                }
              });
        }
and ask it to fill specific variables and provide examples like this:
response_example1 = """{"dataField":"obj.SALES","labelField":"obj.PRODUCTLINE","sortCol":"SALES","sortLabel":"PRODUCTLINE","title":"Total Sales by Product Line"}"""In this scenario, the AI only needs to generate 10-20 tokens instead of the entire chart code. It also limits the types of mistakes to a fairly predictable set that can be predicted. The downside is that you lost the flexibility of a completely open ended AI system.
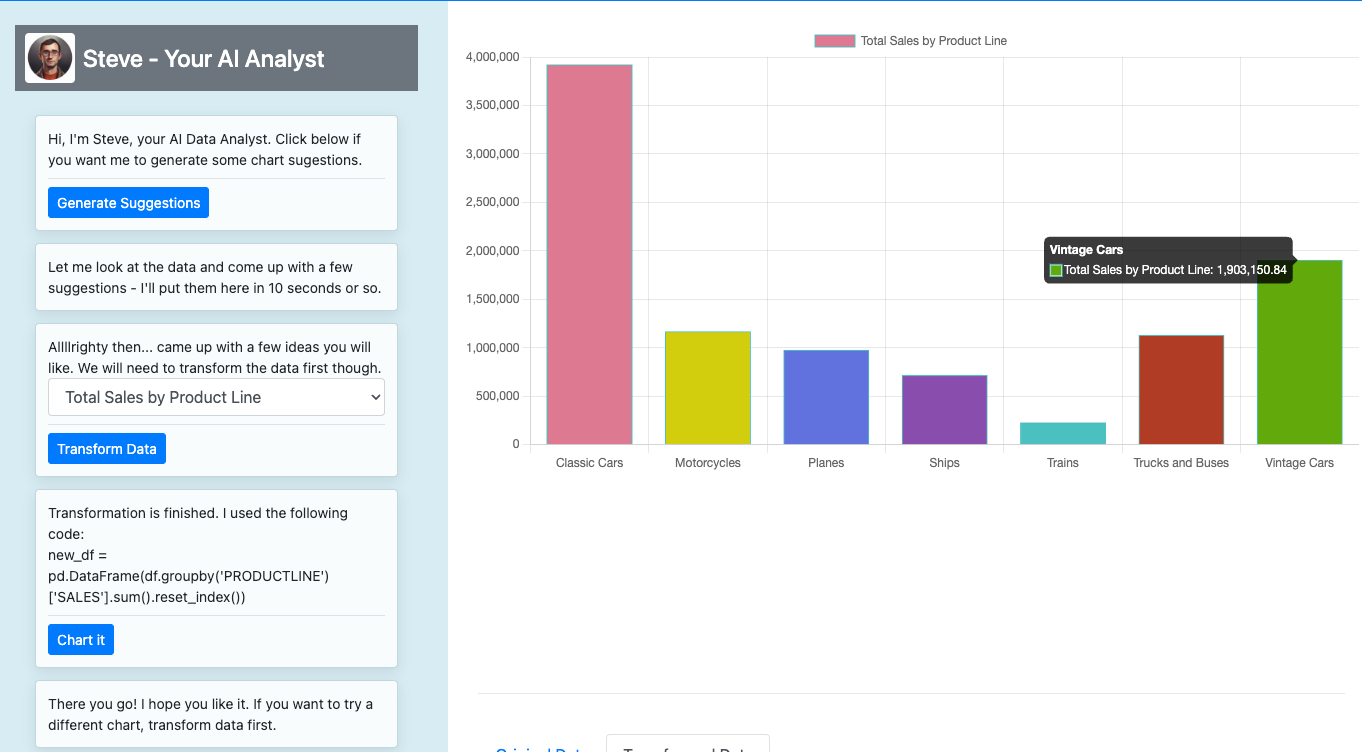
The final result looks like below - we also included a data insight to complete the AI analyst experience.
One Bonus Tip: Self Healing Code-Generation
With the open ended nature of the data transformation - we experimented with having the AI attempt to self heal based on error information:
In order to execute a self-healing request, we create a prompt template that includes an optional variable in our prompt template: (blank on the first run) and populated with traceback information and context for a retry:
traceback_str = "Here is a traceback of an error you encountered before or a statement saying there was no error, please take this into account and avoid the same mistake:" + traceback.format_exc()We’re still monitoring to see how effective this is on initial request errors vs a baseline retry rate with no additional information.
Check out the demo
Check out these techniques in action in the BETA demo app , it’s currently running with the Anthropic Claude API though we may add optionality between Anthropic and OpenAI in the future.
Enjoy!
Note:it’s not optimized for mobile, so I would kick the tires on a larger screen.
Generative Post produced by Gen AI Partners


